
How to Read Your School District Budget Ballot Line by Line

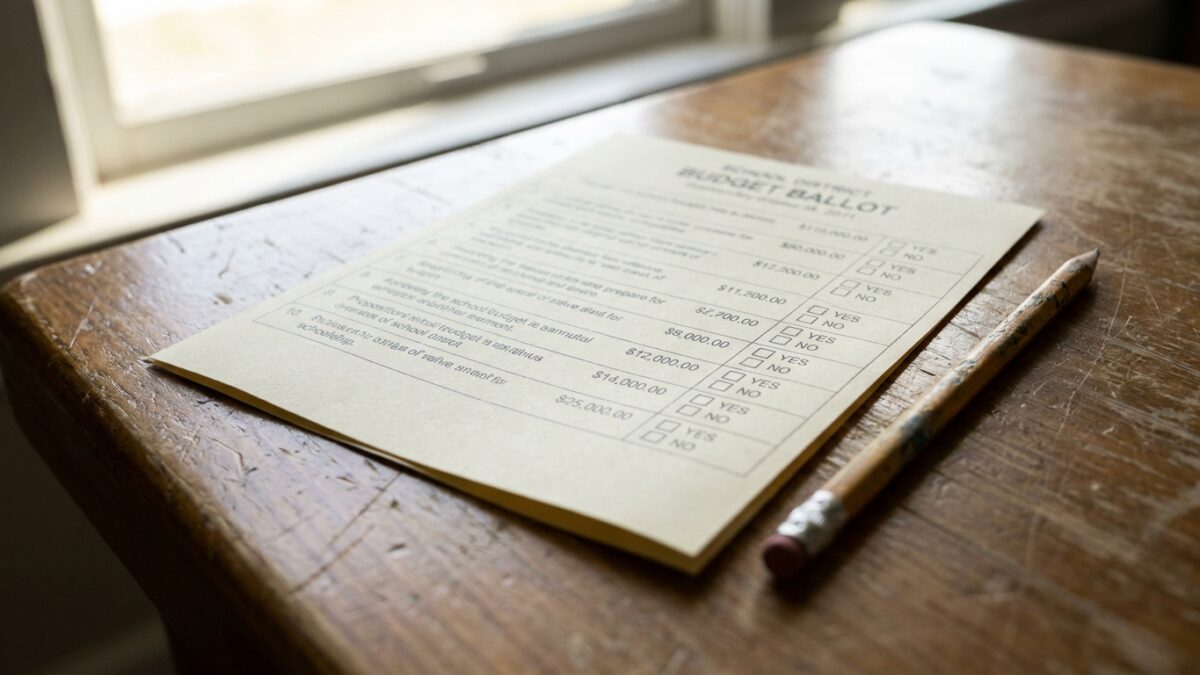
Every spring, Long Island voters face school district budget ballots that list dollar amounts running into the tens or hundreds of millions. These numbers represent more than abstract fiscal policy. They determine classroom sizes, teacher salaries, building maintenance, transportation routes, and ultimately the property tax bills that arrive months later.
Yet many voters enter the booth uncertain about what the figures actually represent or how to evaluate whether a proposed budget merits approval. The ballot itself offers limited context, typically showing a total budget figure, a tax levy amount, and a percentage increase. Reading these numbers effectively requires understanding what they include, what they exclude, and how they connect to the tax bill.
The Total Budget Number
The largest figure on any school budget ballot represents the district’s total proposed spending for the upcoming fiscal year. This amount covers everything the district plans to spend from July 1 through June 30, including salaries, benefits, supplies, utilities, transportation, debt service, and capital projects.
This total budget figure includes money from three primary sources: the local tax levy, state aid, and other revenues such as federal grants or reserve fund withdrawals. Because it combines multiple revenue streams, the total budget can increase even when the tax levy remains flat or decreases. A district receiving substantially more state aid than the previous year might propose a higher overall budget while actually reducing the tax burden on local property owners.
Voters comparing budget totals across years should recognize that not every dollar increase translates to a property tax increase. The relationship between total spending and local taxes depends on how much revenue arrives from Albany and other non-local sources.
The Tax Levy Figure
The tax levy represents the total amount of money the district intends to raise through local property taxes. This figure directly determines tax bills, though the calculation from levy to individual bill involves additional steps based on assessed property values and municipal tax rates.
The tax levy excludes state aid, federal grants, and other non-tax revenues. It represents only what the district will collect from local taxpayers. When a ballot shows a tax levy increase of three percent, it means the district plans to collect three percent more in total property tax revenue than the current year, not that every individual tax bill will rise by exactly three percent.
Different properties within the same district can experience different tax impacts based on assessment changes, STAR exemptions, and municipal-level factors. The levy percentage provides a district-wide average, not a guarantee of individual impact.
The Tax Cap Threshold
New York’s property tax cap law limits annual tax levy increases to two percent or the rate of inflation, whichever is lower, with certain exclusions. Districts can exceed this cap only with approval from sixty percent of voters rather than the simple majority required for budgets within the cap.
Some ballots explicitly state whether the proposed budget falls within or exceeds the tax cap. This designation matters because it changes the threshold for passage. A budget exceeding the cap faces a higher bar and carries different political and practical implications than one remaining underneath the limit.
The cap calculation itself includes complexity that voters rarely see on the ballot. Certain expenses, including pension cost increases above two percent and some capital expenses, can be excluded from the cap calculation. A district might technically stay under the cap while proposing what appears to be a larger increase, or might exceed the cap by a smaller margin than the raw percentage suggests.
Per-Pupil Spending Context
While not always printed directly on the ballot, per-pupil spending figures provide useful context for evaluating district efficiency and priorities. Dividing the total budget by student enrollment yields a per-pupil cost that can be compared across districts and over time.
Wide variation exists across Long Island districts in per-pupil spending, ranging from under fifteen thousand dollars to over forty thousand in the highest-spending districts. These differences reflect factors including teacher salary scales, special education populations, building age and maintenance needs, transportation distances, and administrative structures.
Higher per-pupil spending does not automatically indicate waste, nor does lower spending necessarily signal efficiency. Small districts often face higher per-pupil costs due to inability to achieve economies of scale. Districts with extensive special education services or aging buildings may spend more per student while delivering comparable educational outcomes.
Debt Service and Capital Components
Many school budgets include substantial debt service payments for previously approved capital projects. These payments cover bonds issued for building construction, major renovations, athletic facilities, or technology infrastructure. Debt service typically appears as a line item within the total budget rather than as a separate ballot question.
The principal and interest on existing bonds cannot be reduced without defaulting on obligations. Voters evaluating a budget should recognize that debt service represents committed spending that will continue regardless of budget approval or rejection. The discretionary portion of any budget excludes these mandatory payments.
Some ballots include separate propositions for new capital projects or bus purchases, which would create future debt service obligations. These propositions require separate voter approval and represent long-term commitments extending beyond a single fiscal year.
Contingency Budget Impact
If voters reject a proposed budget twice, districts must adopt a contingency budget that limits spending increases. Understanding contingency requirements helps voters evaluate the consequences of rejection.
Contingency budgets prohibit spending increases except for certain mandatory costs. Districts must eliminate non-essential programs, equipment purchases, and in some cases, positions. Contingency also typically prevents use of school facilities by community groups and may affect extracurricular activities.
The ballot sometimes includes language explaining what specific reductions would occur under contingency, though this information more commonly appears in budget documents distributed before voting day rather than on the ballot itself.
Reading Between the Lines
The numbers printed on the ballot represent the end result of months of budget development, public hearings, and board deliberation. Informed voting requires looking beyond the ballot to budget documents that explain assumptions, enrollment projections, staffing changes, and programmatic priorities.
Most districts publish detailed budget newsletters and hold public presentations before the vote. These materials break down where money comes from and where it goes, often showing pie charts of expense categories and historical trend data. Voters seeking to understand the ballot numbers benefit from reviewing these supporting documents.
The ballot itself offers limited space and must distill complex fiscal planning into a few key figures. Those numbers, properly understood, provide essential information for exercising informed civic participation in the single most significant local government decision voters face each year.